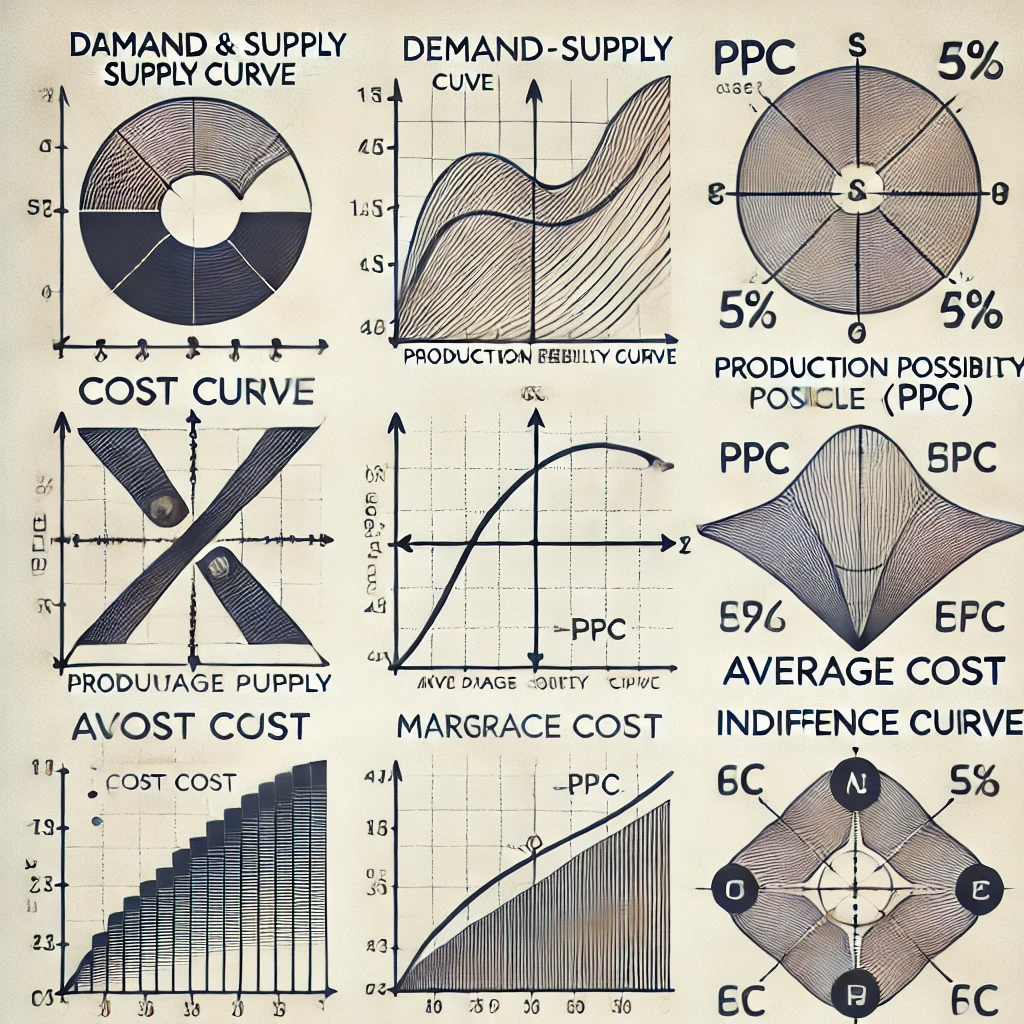
Types of Diagrams in Class 12th Gujarat Board Economics

Introduction
In Class 12th Economics for the Gujarat Board (GSEB), understanding various diagrams is crucial for mastering core economic concepts. These diagrams are visual representations that help simplify complex ideas like demand and supply, costs, and production. In this blog, we’ll dive into the different types of diagrams used in the syllabus, offering insights into how they are constructed and interpreted.
1. Demand and Supply Curve
One of the most important diagrams in economics, the demand and supply curve represents the relationship between the price of goods and the quantity supplied or demanded. Key points:
- X-Axis: Quantity of goods
- Y-Axis: Price of goods
- Equilibrium Point: Where the demand and supply curves intersect, showing the market price.
2. Production Possibility Curve (PPC)
This diagram shows the maximum possible output combinations of two goods that an economy can achieve when resources are fully and efficiently used. It’s used to illustrate trade-offs, opportunity costs, and economic efficiency.
3. Cost Curves
Cost curves illustrate the relationship between output and costs in economics. Major cost curves include:
- Average Cost (AC) Curve
- Marginal Cost (MC) Curve These curves help in understanding the firm’s production decisions and pricing strategies.
4. Revenue Curves
Revenue curves, such as total revenue and marginal revenue, depict the relationship between a firm’s output and its revenue generation. These diagrams are essential for understanding profit maximization and pricing strategies in competitive markets.
5. Indifference Curve
An indifference curve represents different combinations of two goods that provide the consumer with equal satisfaction and utility. The curve helps in analyzing consumer preferences and choices.
Conclusion
Mastering these diagrams will give you a solid foundation in understanding the critical concepts of economics in the GSEB curriculum. Whether you’re interpreting demand and supply or evaluating costs and production, diagrams are a valuable tool to visualize and comprehend economic theories.
